Stories
The Simpsons show is an American animated sitcom created by Matt Groening. The series is a satirical
depiction of American life, epitomized by the Simpson family, which consists of Homer, Marge, Bart,
Lisa, and Maggie. Since its debut on December 17, 1989, 750 episodes of the show have been broadcast as
of May 21 2023. It is the longest-running American animated series, longest-running American sitcom, and
the longest-running American scripted primetime television series, both in terms of seasons and number
of episodes. What you will see below is the outcomes of visual-oriented analysis on this show that has
span across decades.
Just like every other analysis, this analysis too needed robust data that holds important information.
The dataset we got from Kaggle best fitted the criteria. The entire dataset was spread across four
tables, Episodes, Locations, Characters and Script Lines. Each table had a ID column. The Script Lines
dataset is the main dataset to which the other datasets are linked using their respective ID's. The
Script Lines datasets consists of 140749 lines that was either spoken by characters or were expressions
or sounds given by characters or descriptive lines that were used to explain scene to audience. Each
record of line had its own ID and included details about who and where the line was used, in which
episode of which season and the word count of the line. This mammoth information allowed us to analyse
various aspects of the show across the years. We have come up with a total of four dashboard, 2 for
analysis of show as a whole and 1 each for the Characters and locations appeared. Along with this, a
story made from important visualisations of each dashboard, is included.
The analysis aids in understanding the reach of the show over the years, and the response it got from
the audience and critics. This analysis is limited to the year 2015, due to constraints of the dataset.
The category wise analysis of the show with apt and different kind of visualisations provided lot of
insights about the show. This project purpose isn't oriented towards finding reason or cause for a
particular observation rather it aims to get a general overview to understand the show better.
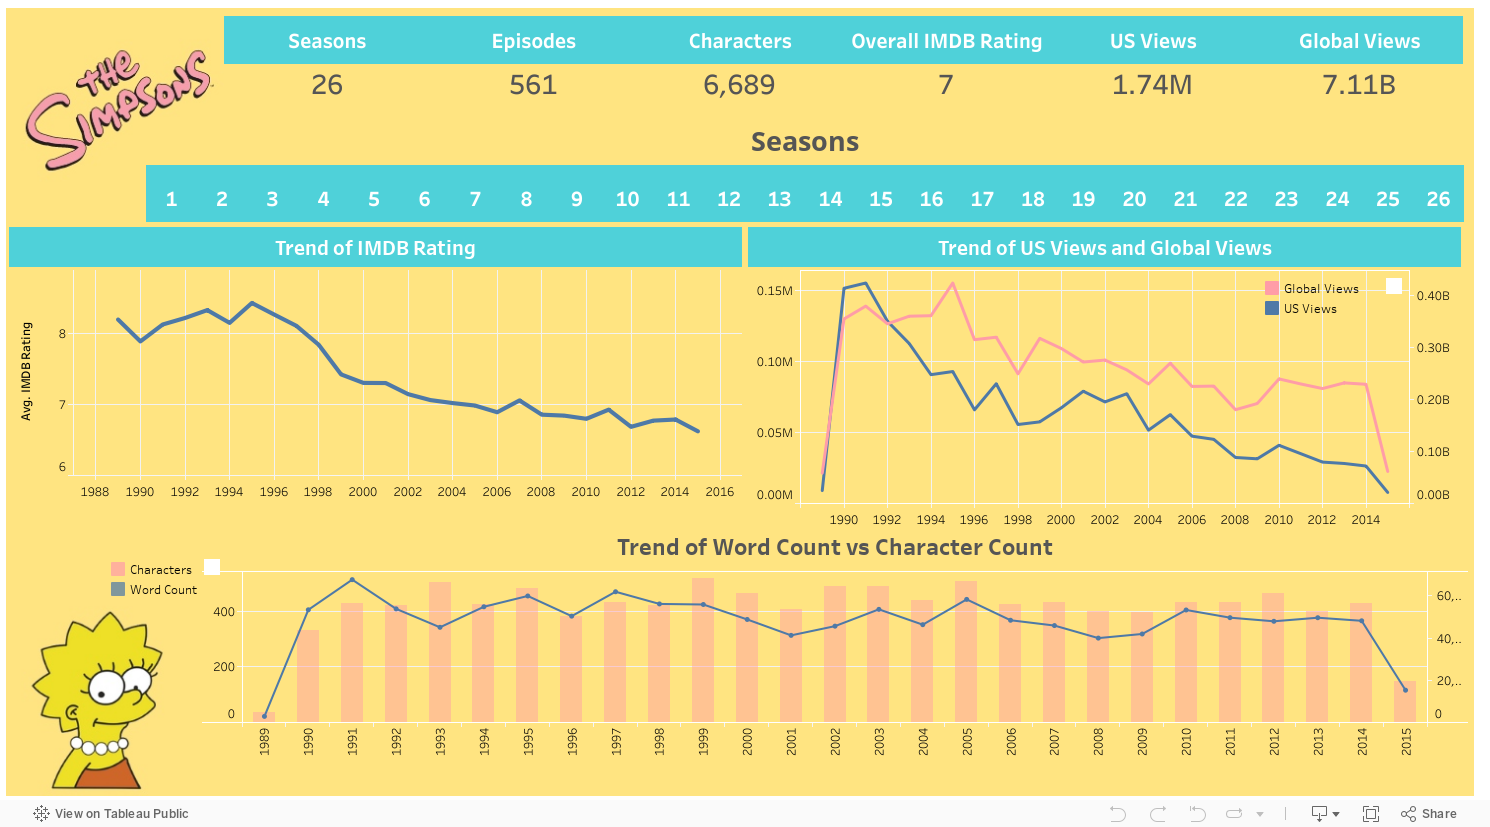
On analysing the show as a whole we can find observation of many parameters like viewership, rating, etc. It
is found that over the years the rating and viewership of the show gradually declined. The highest rating or
viewership were for the initial episodes of the show while the recent episodes grabbed less viewership and
rating. The highest US Views recorded is 0.16M in 1991 and that of global views is 0.42B in 1995 and the
year 2015 recorded the lowest US views 0.01M and 0.06B global views. And the highest rating is 8.434 in 1995
and the lowest rating is 6.623 in 2015. This trend of decline in viewership is observed both on the country
( United States ) and on global level. This is a matter of concern because though after 20th century there
has been huge development in the multi-media domain the show struggled to attract audience. With the
increases in population with digital device which will allow to view the show with ease, the viewership went
on declining scale after 1995. A similar trend in rating reveals the disappointment of the active audience
and critics. The next parameter of observation of word count and character count over the years. It was
observed that both these parameters shared a strong relationship between them. Throughout the show as the
word count increases the characters appeared in the year also increases and vice versa. This suggest that in
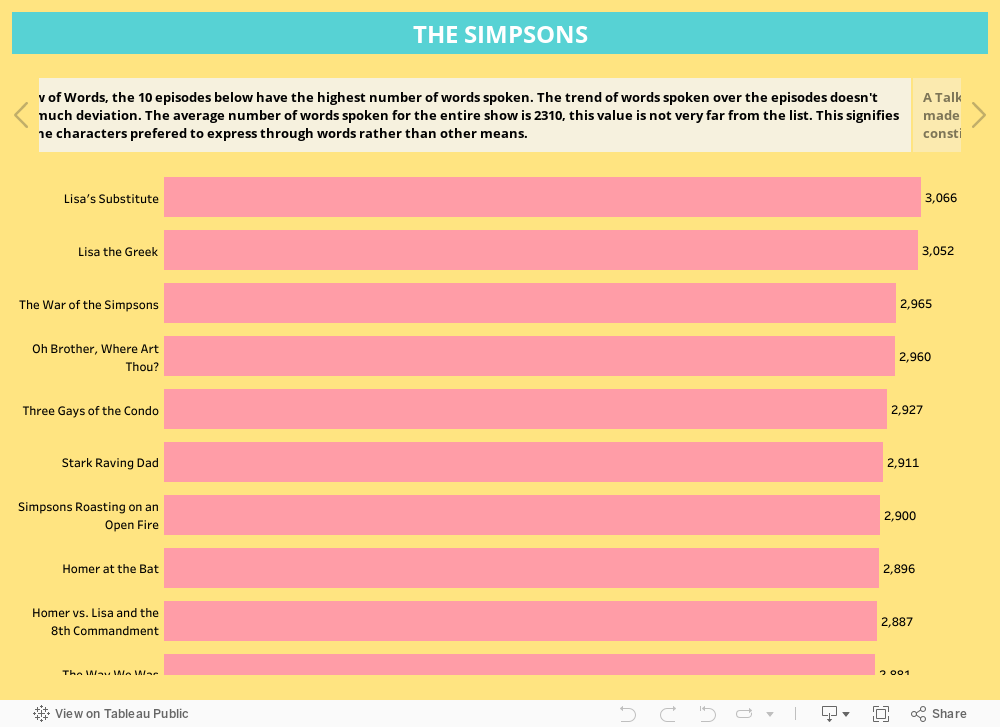
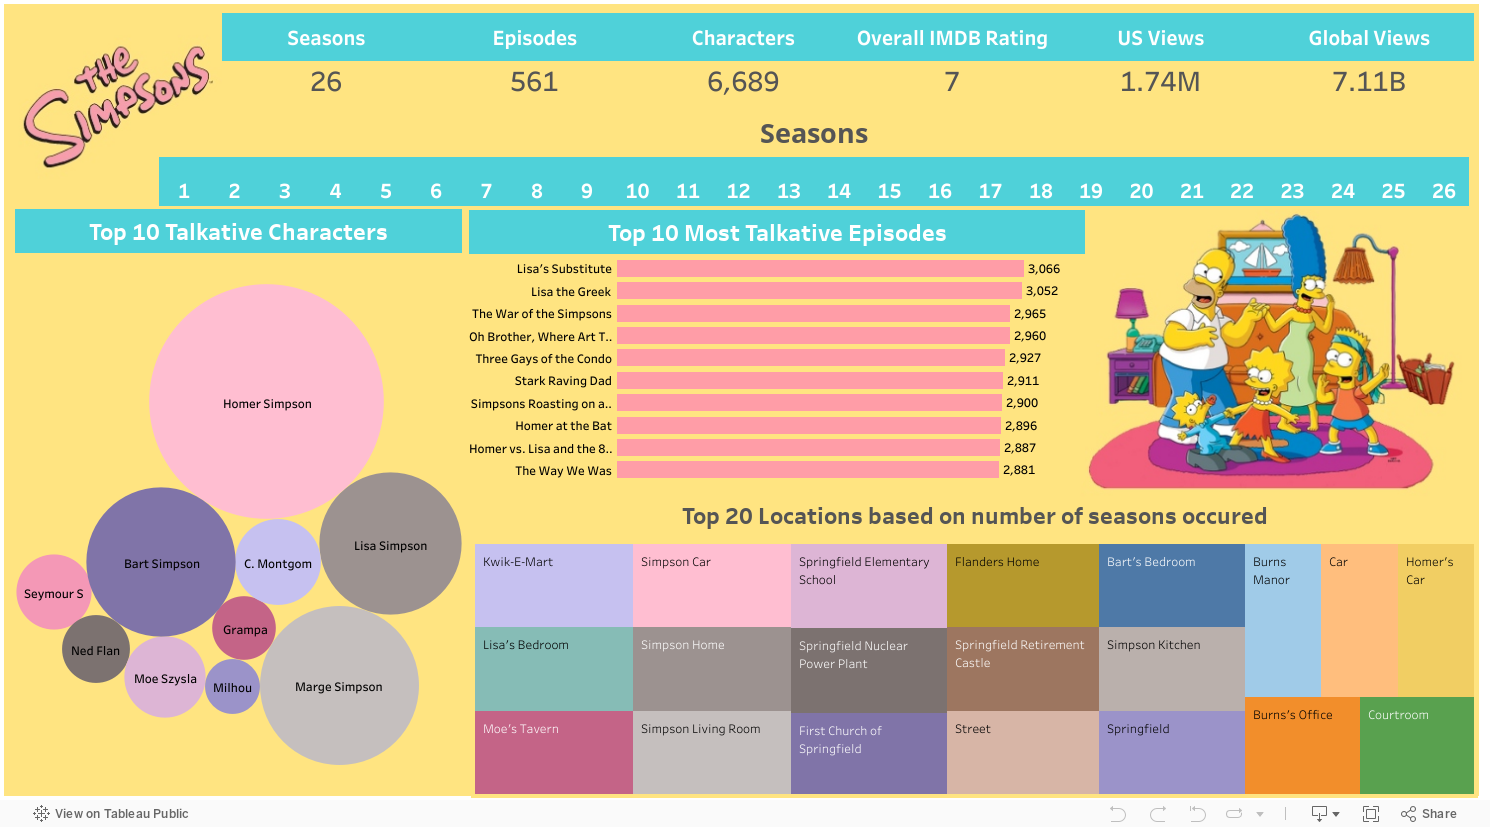
each episode the count of script lines might have been fairly divided among characters. The horizontal bar
chart of Top 10 Talkative characters shows that there is no huge difference in number of words spoken
between episodes. And while converting this into a line chart covering all episodes it was found that for
most of the episodes the word count was more than 2000.
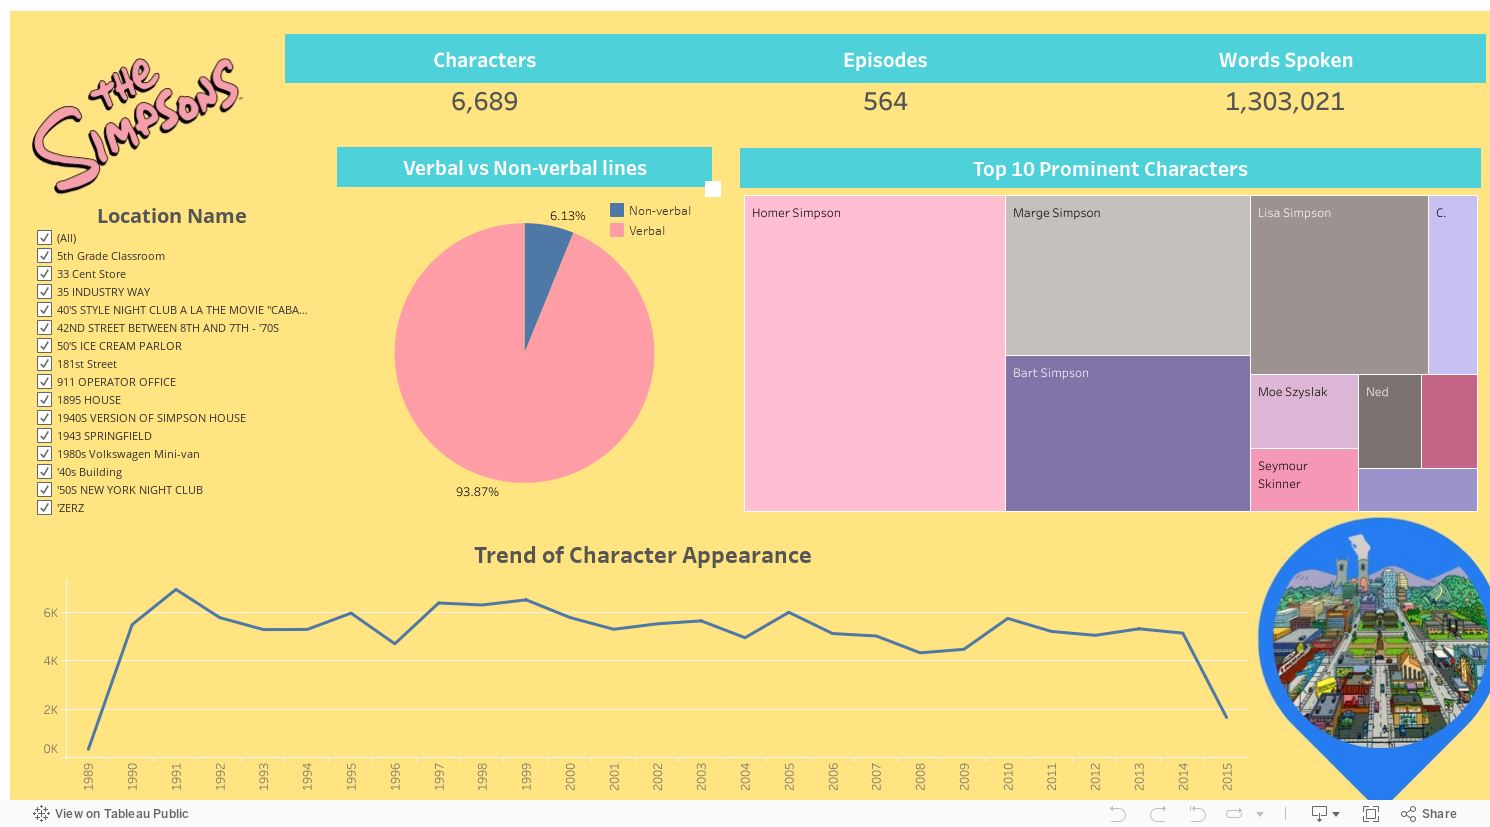
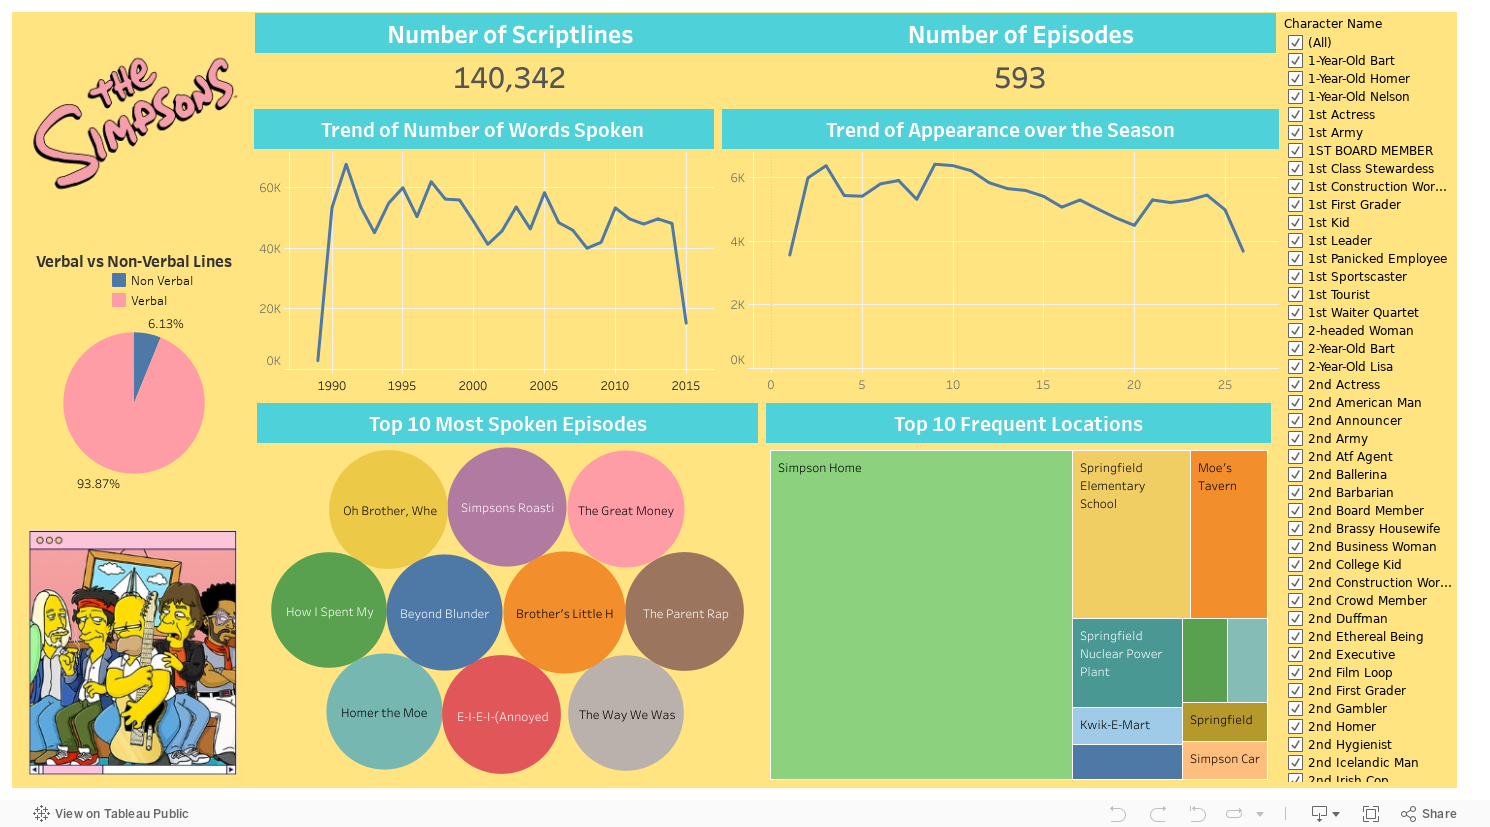
The Speaking Line attribute of the Script Line Dataset allowed to know whether a particular line was made of
verbal or non - verbal means. The non - verbal lines constitute of line explaining the situation or sounds
or expressions given by characters or different noises. A dedicated pie chart for this parameter reveals
that the show has 93.87% as verbal lines while the remaining as non - verbal. Even though this parameter is
not so significant like other parameters this tells an important and obvious of the show, which is the show
is more talkative. Generally, cartoon shows might have a lot of different sounds and funny noise, but this
show is quite opposite, and this is because this show targets adult audience. The adult audience prefer
content over different voices.
The individual analysis of each location in the show reveals insights like, how many verbal or non - verbal
lines was spoken there, who are the top 10 people who spoke the greatest number of lines there and the trend
of character visit to that location over the years. These insights seem to vary with each location and it's
hard to get a general conclusion because of the huge set of locations available and high degree of variation
between them.
In the same way the analysis of each character of the show reveals the character contribution and character
nature. The analysis reveals whether the character preferred verbal or non - verbal means to communicate,
the 10 most spoken locations and episodes of the character, the trend observed in his appearances over the
years and the trend of his word count over the years.